Ans: D


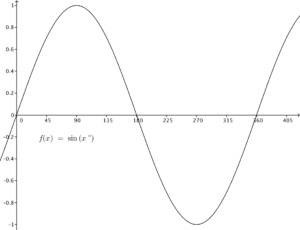
The above figure is the graph of $y=\sin x^\circ$. By comparing the two figures, we found that the graph of $y=\sin x^\circ$ is enlarged along the $y$-axis $2$ times and then translated to the left $30$ units. Therefore, the figure shows the graph of $y=2\sin(x^\circ + 30^\circ)$. Hence $k=2$ and $\theta =30^\circ$.

