Ans: A
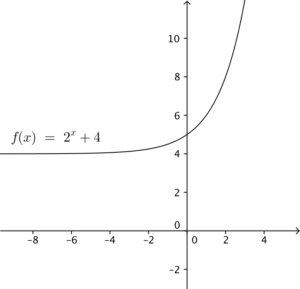
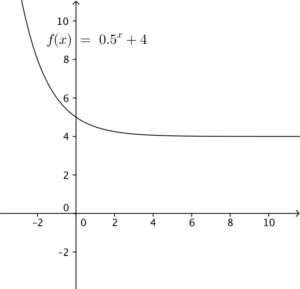
According to the figure, the $y$ intercept of the graph is positive. Hence $b > 0$.

According to the figure, the $y$ intercept of the graph is positive. Hence $b > 0$.
Consider $a > 1$. Without loss of generality, take $a=2$, the graph will be

Consider $0 < a < 1$. Without loss of generality, take $a=0.5$, the graph will be

Hence, A is the correct answer.

